


Executive Summary
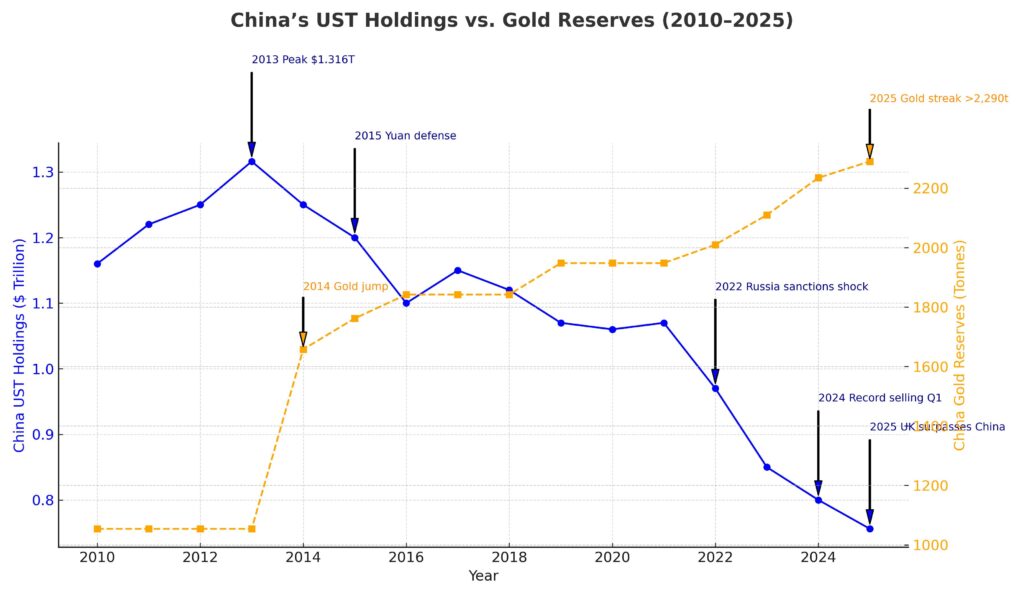
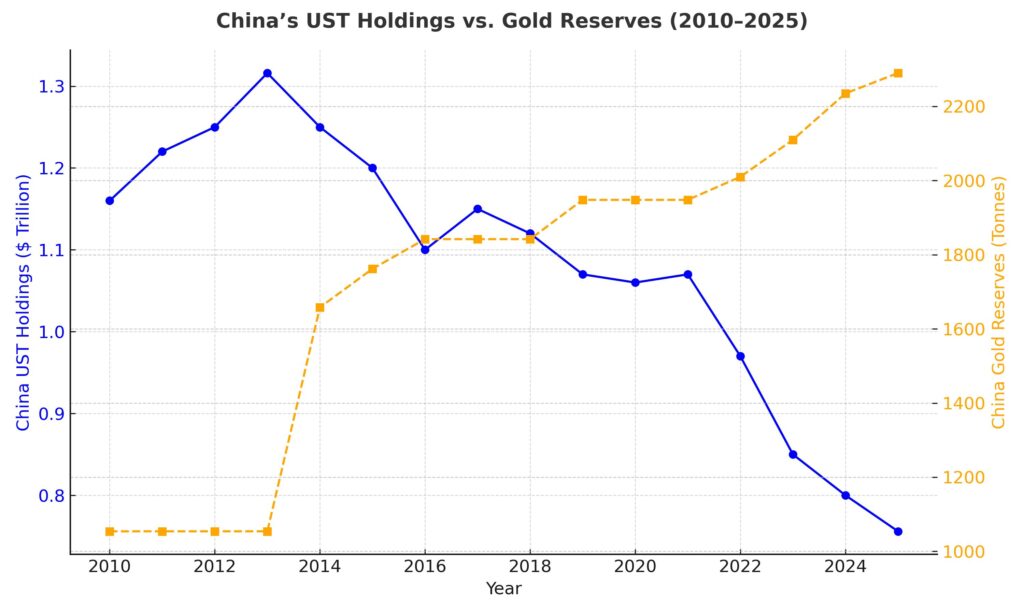
China’s retreat from U.S. Treasuries marks a quiet but consequential shift in global finance. From a peak of $1.3 trillion in 2013, Beijing’s holdings have dropped to $756 billion by mid-2025, their lowest in 15 years. The move reflects a strategic recalibration: diversifying reserves into gold and non-U.S. assets, insulating against the sanctions risk exposed by Russia’s frozen reserves in 2022, and seeking greater control over its currency.
While global demand for Treasuries remains strong, China’s withdrawal carries weight beyond numbers. It signals a loosening of financial interdependence between Washington and Beijing, highlights the geopolitical risk embedded in dollar assets, and hints at the fragmentation of the global reserve system. The long-term consequence could be higher U.S. borrowing costs and a faster push toward multi-currency reserves, even as China balances the liquidity trade-offs of stepping back from the world’s deepest bond market.
Cause: This retreat stems from multiple drivers. Rising U.S.–China tensions, particularly after Washington weaponized the dollar in sanctions against Russia in 2022, alarmed Beijing about the risks of overexposure to U.S. assets. Domestically, China has also faced slower growth, a weakening yuan, and the need to support its economy by diversifying reserves. At the same time, Beijing has steadily built up its gold reserves, signaling a strategic shift toward tangible stores of value.
Effect: The direct impact has been felt in bond markets and currency dynamics. U.S. yields have inched higher, though strong demand from other buyers (Japan, institutional investors, and domestic U.S. funds) has softened the blow. More importantly, the sell-off underscores a geopolitical tug of war: the U.S. dollar’s dominance is being challenged, and China is promoting alternatives such as the yuan in cross-border trade and digital currency initiatives.
Consequences: If the trend accelerates, several scenarios emerge. U.S. financing costs could rise, complicating Washington’s already ballooning debt trajectory. China, meanwhile, risks capital flight or currency volatility if diversification moves too aggressively. Globally, this slow but steady pivot could mark the beginning of a multi-polar reserve system, where gold, the euro, and regional currencies gain greater influence at the expense of the dollar’s unchallenged supremacy.
In short, China’s shedding of Treasuries is not merely a financial adjustment—it is a geoeconomic signal. It reveals how the world’s second-largest economy is recalibrating its defenses in a financial order where trust in the dollar is no longer taken for granted.
Executive summary (dates & data you can verify)
- China’s U.S. Treasury holdings have fallen to the lowest level since 2009, sitting around $756.4 billion as of June 2025 (down ~40% from the $1.32 trillion peak in 2013). Over the past year, the UK overtook China as the second-largest holder after Japan. U.S. Department of the TreasuryReuters
- 2024–2025 marked an acceleration of the multiyear draw-down: in Q1 2024 Beijing offloaded a record sum of Treasuries and U.S. agency bonds (~$53 billion combined), a pace consistent with reserve diversification and geopolitical risk management. Bloomberg.com
- At the same time, China has been adding gold to reserves in waves; 2025 saw nine consecutive months of official purchases through July, taking reported holdings above 2,290 t and lifting gold’s share of reserves. ReutersWorld Gold Council
- Methodological caution: U.S. Treasury’s TIC tables warn that holdings are recorded by custody location (e.g., London, Luxembourg, Belgium), so some shifts may reflect re-custody, not true sales. Even with that caveat, the multi-year trend is unmistakably down. U.S. Department of the Treasury
The long arc: 2008–2025 in five chapters
1) Post-GFC accumulation and the 2013 peak
China built a vast Treasury portfolio as exports surged and FX reserves swelled after 2008, peaking near $1.316 trillion in late 2013. That peak is visible across official TIC time series and independent compilers. U.S. Department of the TreasuryCEIC Data


2) 2015–2017: Yuan defense and reserve use
The August 2015 RMB devaluation and subsequent capital outflow pressures pushed authorities to use reserves more actively. Treasury holdings began a measured decline as SAFE stabilized the currency—an early sign that portfolios would be tapped for policy aims. (TIC series show the step-down beginning in this window.) U.S. Department of the Treasury
3) 2018–2019: Trade-war frictions
Tariffs and tech restrictions elevated the sanctions risk of dollar assets. China trimmed U.S. bonds further, balancing liquidity needs against rising political risk premiums. Reuters
4) 2022–2024: The Russia lesson & diversification
After the West froze Russia’s FX reserves in 2022, Beijing’s debate shifted from “whether” to “how fast” to diversify. Reporting in 2024 highlighted record quarterly reductions in Treasury + agency exposure and a pivot to gold and non-U.S. assets, consistent with SAFE’s “tengnuo”—agile maneuvering—playbook. Financial TimesBloomberg.com
5) 2025: New lows, new pecking order
By March–June 2025, the UK surpassed China as #2 holder; China’s line sits mid-$750s bn—the lowest since 2009—even as global foreign holdings of Treasuries hit a record $9.13 trillion. The decline is China-specific, not global. Reuters
What the latest data say (with context)
- China, Mainland: $756.4 bn (June 2025) vs ~$780 bn (June 2024). Down ~3% y/y and ~43% from the 2013 peak. U.S. Department of the Treasury
- Japan: still #1 at $1.148 trillion; UK: $858 billion, overtaking China in March 2025—a shift partly reflecting London’s role as global custodian as well as genuine buying. U.S. Department of the TreasuryReuters
- Caveat from the source: TIC stresses data are primarily from U.S. custodians/brokers; assets held via overseas custodians may be attributed to the custodian’s country, not the beneficial owner (hence the “Belgium/Luxembourg effect”). The trend is still clearly down for China despite this noise. U.S. Department of the Treasury
Why Beijing is doing this
- Sanctions & financial security risk
The Russia freeze crystalized the risk that official dollar assets can be immobilized in a conflict. Diversifying away from U.S. government paper reduces that tail risk. Financial Times - Reserve composition & return
The World Gold Council and market surveys show official-sector gold demand surging, with China a prominent buyer. Gold offers no counterparty risk and, in 2025, strong price momentum. World Gold Council+1 - FX policy flexibility
Selling Treasuries (or slowing purchases) frees SAFE to manage the RMB without swelling dollar exposure, while still keeping deep-liquidity options elsewhere (short-dated bills, swaps, non-USD assets). TIC flow data around Q1 2024 confirm an episode of accelerated selling. Bloomberg.com - Geopolitics & “de-risking”
A controlled, gradual reallocation aligns with Beijing’s desire to minimize market signal risk—avoiding a panic or spike in yields that would hurt the value of residual holdings. FT reporting termed this a slow, “agile” transition rather than a dump. Financial Times
Where the money is going
- Gold: The PBoC extended a fresh buying streak to nine months through July 2025, pushing reported holdings above 2,290 t (≈6% of reserves). Independent analysts believe true gold holdings may be higher than reported, given historical lags and opaque channels. ReutersWorld Gold CouncilMarketWatch
- Non-U.S. assets: SAFE has explored non-USD sovereigns, quasi-sovereigns, and assets issued outside the U.S., including Hong Kong-linked and Asia-regional paper. Agency exposure has at times been trimmed alongside Treasuries amid U.S. housing-finance policy uncertainty. Financial Times
Market impact: smaller than the headlines imply
- Despite China’s decline, global foreign ownership of Treasuries hit a record $9.13 trillion in June 2025. Other official and private buyers have backfilled demand, limiting the yield impact of China’s steady drawdown. Reuters
- Episodes like Q1 2024 can jolt liquidity, but U.S. debt’s depth and collateral role cushion the market. The bigger medium-term swing factor for yields remains Fed policy and domestic deficits, not any single foreign holder. (TIC and Treasury releases underscore the scale and breadth of demand.) U.S. Department of the Treasury
The investigative trail: key dates & numbers
- Nov 2013: China’s UST peak near $1.316 trillion. CEIC Data
- Aug 2015–2016: RMB defense; sustained net reserve use and slower UST accumulation. U.S. Department of the Treasury
- 2018–2019: Trade-war phase; holdings trend lower. Reuters
- 2022: Russia sanctions shock; Beijing’s internal consensus shifts toward de-risking dollar exposure. Financial Times
- Q1 2024: Record quarterly selling of Treasuries + agencies (~$53 bn). Bloomberg.com
- Mar–Jun 2025: UK surpasses China as #2 holder; China at $756.4 bn (June), lowest since 2009. Foreign holdings total a record $9.13 tn. U.S. Department of the TreasuryReuters
- Jan–Jul 2025: Nine straight months of PBoC gold purchases. ReutersWorld Gold Council
What to watch next
- Cadence vs. cliff: All signals point to gradualism, not a fire sale. Watch for month-to-month TIC shifts clustered around policy events (tariffs, export controls, Taiwan tensions). U.S. Department of the Treasury
- Gold share of reserves: If reported gold rises above ~7–8% of reserves, it would mark a structural reweighting versus a tactical hedge. World Gold Council and monthly PBoC reserve releases are the tells. World Gold Council+1
- Custody migration: Sudden jumps in Belgium/Luxembourg/UK lines may signal re-custody rather than true sales—read TIC notes before inferring intent. U.S. Department of the Treasury
- Auction coverage & bills vs. bonds mix: If China pivots further from long bonds toward bills (or out of the curve entirely), the duration profile of foreign demand could shift, nudging term premia. TIC and Treasury auction stats will show it. U.S. Department of the Treasury
Bottom line
China’s “tug of war” isn’t a dramatic dump—it’s a disciplined, multi-year repositioning: smaller U.S. Treasury footprint, bigger gold allocation, and broader non-U.S. exposure. The trend has lowered China’s stake to ~$756 bn (June 2025) from a $1.3 tn peak, while the global bid for Treasuries remains intact. The strategic goal is optionality under stress—a portfolio that’s more sanction-resilient, less dollar-dependent, yet still liquid enough to manage the RMB and shocks. U.S. Department of the TreasuryReutersFinancial Times
Although China still owns $ 756.3 billion in US government bonds, the recent sales are in line with advice from Chinese policy advisers to be less dependent on American debt. Instead, more should be invested in alternative, more stable assets such as gold and other metals.
____________________________________________________________________________________
READ SECOND IN SERIE
Data you can track
Treasury (TIC) – Major Foreign Holders Table 5 (official monthly holdings; read the custody caveat). U.S. Department of the Treasury
U.S. Treasury TIC releases & calendar (flow data, next publication dates). U.S. Department of the Treasury
Reuters (holdings milestones, market context) and FT (diversification strategy) for corroboration and analysis. ReutersFinancial Times
World Gold Council & Reuters for PBoC gold moves. World Gold CouncilReuters